
The Most Comprehensive Technical Analysis Course in India
Stop Gambling on Tips. Join the Best Technical Analysis Course in India to Learn Price Action, Chart Patterns, and Risk Management in Live Markets with Chanakya Investments.
100 %
Practical Training
5000 +
Students Trained
10 +
Years Experience
100 %
Placement Support
Tips don't build skill. Reading charts does.
90% of beginners in the stock market lose their capital within the first 90 days. Why? Because they treat trading like a “casino,” not a “business.” They trade based on tips heard on news channels or press the buy/sell button without any logic.
If you are looking for a technical analysis course in India, it means you want to be different from that 90% crowd. You want to understand the market.
At Chanakya Investments, we believe that trading is not magic. It’s a skill—a skill that can be learned. Our Advanced Technical Analysis Course teaches you the language of charts (the language of price). We teach you how institutions (FIIs/DIIs) move the market and how you can follow their footprints.
Whether you are in Hyderabad or any other part of India, our Online & Offline Hybrid Model gives you the opportunity to become a professional trader.

What actually makes this the best technical analysis course in India
There are thousands of courses in the market, but what makes Chanakya Investments different?
Live market mentorship — no recordings
The market changes every day; a recorded video from six months ago doesn't. We run live sessions on Nifty and Bank Nifty from 9:15 AM to 3:30 PM, and you watch real decisions get made in real time, including the ones that don't work out.
Hybrid learning: offline in Hyderabad, online everywhere
In Hyderabad, you can learn face-to-face at our Beeramguda campus. Outside Hyderabad, you join the identical live sessions over Zoom — same instructor, same curriculum, same trading room.
Zero-to-hero curriculum, built on NISM standards
We assume nothing. The course starts at "what is a candlestick?" and builds, module by module, to algorithmic strategy concepts — combining NISM standards with practical, real-market application.
You trade alongside other students, not alone
The live trading room means you're discussing setups with senior students during market hours — the kind of peer accountability that's missing from a solo video course.

Six modules, in the order skill is actually built
This isn’t a course — it’s a complete trading curriculum. Every module is taught live and builds directly on the one before it. Expand any module to see exactly what’s covered.
The Foundation of Price
- Candlestick anatomy: what Open, High, Low and Close actually tell you about the fight between buyers and sellers.
- Single-candle patterns: Doji and Spinning Tops as signs of indecision.
- Hammer & Shooting Star: the two most reliable single-candle reversal signals, and how to confirm them.
- Marubozu: reading strong, one-sided buying or selling pressure.
- Multi-candle patterns: Engulfing, Harami, and Morning/Evening Star setups.
- Reading candles in context: why the same candle means different things at support vs. in open space.
Classical Chart Patterns
- Reversal patterns: Head & Shoulders and Double Top/Bottom — how to spot them before they’re obvious.
- Continuation patterns: Flags, Pennants, and Triangles as pauses inside an existing trend.
- Volume confirmation: why a pattern without volume is just a shape on a chart.
- Breakout vs. fakeout: the checklist we use to tell a real breakout from a trap.
- Measuring price targets: projecting realistic targets from pattern height, not guesswork.
Indicator Science & Oscillators
- Moving averages: SMA vs. EMA, and how the Golden Cross / Death Cross actually works.
- RSI: reading overbought/oversold zones and spotting divergence.
- MACD: using crossovers and histogram momentum together, not in isolation.
- Bollinger Bands: volatility squeezes and band-walk behaviour.
- Stochastic oscillator and on-balance volume (OBV) for confirming price moves.
- Indicator confluence: why stacking five indicators on one chart usually makes decisions worse, not better.
Dow Theory & Elliott Wave Basics
- Dow Theory structure: Higher Highs and Lower Lows, and how to apply “the trend is your friend.”
- Top-down timeframe analysis: how the monthly trend should shape what you do on a 5-minute chart.
- Support & resistance: drawing real supply/demand zones instead of arbitrary lines.
- Elliott Wave basics: the five-wave impulse and three-wave correction structure, and where it’s useful vs. overfit.
Intraday Trading Strategies & Setup
- Opening Range Breakout (ORB): a rules-based way to trade the first 15–30 minutes.
- VWAP-based entries: using volume-weighted average price as an intraday bias filter.
- Gap trading: gap-up/gap-down behaviour and how to react to it.
- Pre-market screening: building a daily watchlist instead of reacting to news alerts.
- Order types in practice: stop-loss, SL-M, and bracket orders, and when each one protects you.
Risk Management & Trading Psychology
- Position sizing: deciding how much to risk per trade before you decide what to trade.
- Stop-loss placement logic: setting stops based on structure, not on how much pain you can tolerate.
- Risk-reward ratio and why a high win rate with poor R:R can still lose money.
- Trading journal discipline: the habit that separates students who improve from those who repeat mistakes.
- Common biases: FOMO, revenge trading, and overconfidence — and how to catch yourself in the act.
- Building a personal trading plan you can actually follow under pressure.

Meet Your Mentor: Mallinath Mulage
“Experience is the best teacher, but learning from someone else’s experience is smarter.”
Mallinath Mulage, founder of Chanakya Investments is a seasoned stock market veteran. Having navigated through volatile market phases like the Post-Covid Bull Run and Global Market corrections, Mallinath Sir brings practical wisdom to the table.
- Approach: They don’t use complex financial jargon. They teach in simple language that even a student or a housewife can understand.
- Philosophy: “Protect your capital first, then earn a profit.”
Experience and Expertise
From Mr. Mulage’s background in the financial markets, he has been able to gather a wealth of knowledge along with practical experience that could only be obtained through spending years working in the center of activity. He combines strategic thinking with hands-on experience, having experienced the highs and lows of the market. His broad portfolio also encompasses the fact that he has already educated more than 1000+ traders and investors from around India, both offline and online.
Who benefits from this technical analysis course in India
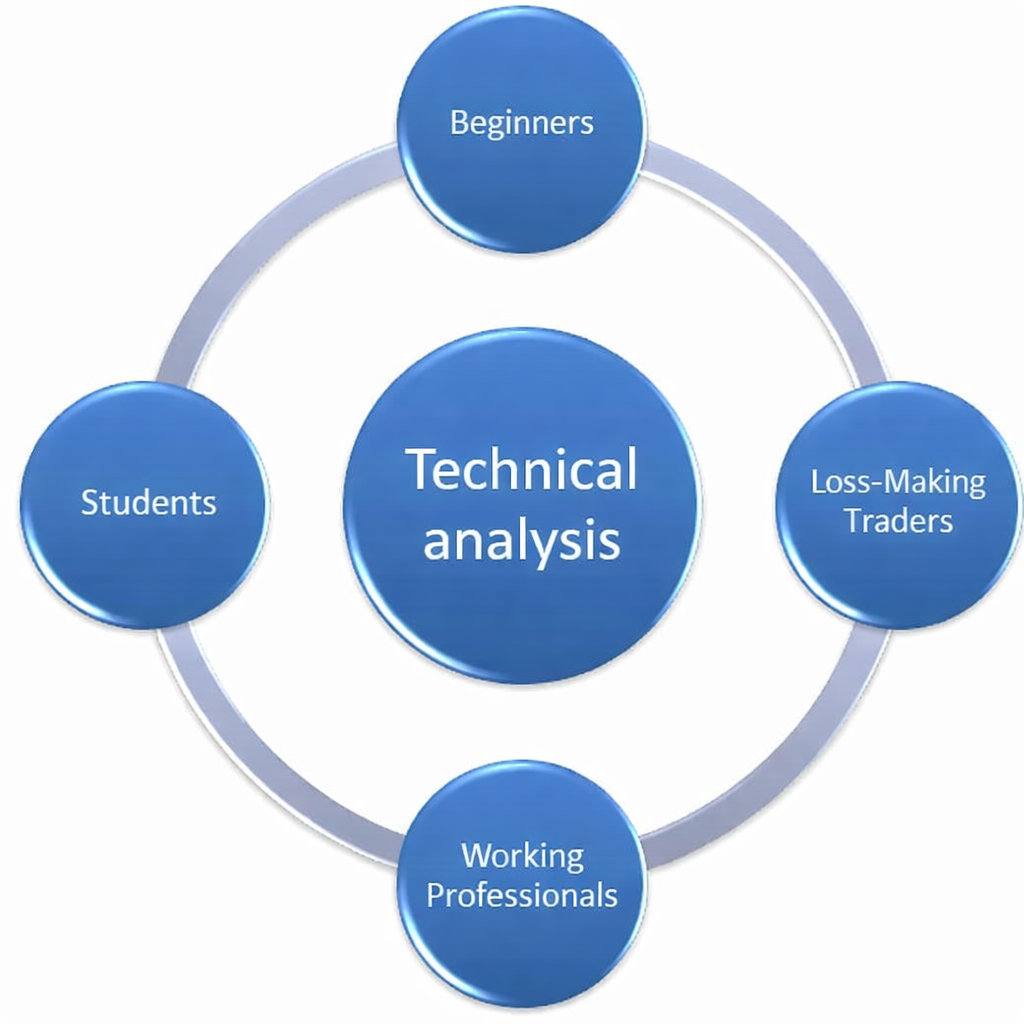
This technical analysis course in India is suitable for beginners starting from zero, loss-making traders looking to improve their trading approach, working professionals aiming to earn additional income through trading, and students preparing for a career in finance with NCFM or NISM certifications.
Beginners
Haven't opened a demat account yet. We teach the basics — equity, IPO, demat — before a single chart pattern.
Loss-Making Traders
Already trading, already losing. You'll learn to replace tips and gut feel with a repeatable, rules-based method.
Working Professionals
Looking to build a structured second income stream around market hours, without quitting your day job.
Students
Building a finance career and preparing for NCFM/NISM certifications alongside practical market skill.
Tools & Resources You Get
With enrollment, you’ll receive not only classes, but also these tools:
1. Lifetime Access to Course Material: Recordings available for revision (for online students).
2. Proprietary Signal Software Access: Our special tool that helps you filter trading signals.
3. Live Trading Room: Discussions with senior students during market hours.
4. Certificate of Completion: Add to your CV that you are a Certified Technical Analyst.

Frequently Asked Questions (FAQs)
Q1: I am a complete beginner, can I take the technical analysis course?
Ans: Yes, absolutely! Our course starts from “Zero-Level.” We assume you don’t even know the basics of the market. We start with basic terms (Equity, IPO, Demat) and progress to advanced charts. This is the best course for beginners in the stock market.
Q2: How much time does it take to learn Technical Analysis course?
Ans: Our course structure is 1-2 months, but mastery comes with practice. After the course, we provide you with hand-holding support for 6 months so that you feel confident in the live market.
Q3: Is Intraday Trading covered in this course?
Ans: Yes. We have dedicated strategies for Intraday trading such as the ‘Open High/Low Strategy’ and ‘VWAP Strategy’. We also teach you when not to do Intraday trading.
Q4: What is the difference between the Online and Offline courses?
Ans: The content is exactly the same. Offline classes are held at our Hyderabad (Beeramguda) center where you sit in front of the mentor. Online classes are live on Zoom where you can ask doubts by sharing your screen.
Q5: How much can I earn after this course?
Ans: There is no guarantee of profit in the stock market. We are not selling you a “Get Rich Quick” scheme. We are teaching you a skill. If you follow the discipline, you have the potential to generate more monthly income than your salary.
Q6: What are the career options after learning Technical Analysis course in India?
Ans: Besides trading, you can also find jobs in the financial sector. You can start your career as a Technical Analyst, Research Analyst, or Relationship Manager in a broking firm.
Q7: I am a complete beginner. Can I take this technical analysis course?
Ans: Yes. The course starts from zero — we assume no prior market knowledge and begin with basic terms like equity, IPO, and demat before moving into candlestick reading and chart patterns.
Q8: Will I get a certificate after completing the course?
Ans: