
What is Candlestick Pattern?
A candlestick is the price behavior of an asset for some time period, which can be 1 minute, 1 hour, or 1 day.
Each candlestick has:
Body: Difference between opening price and closing price.
Wick(Shadow): Maximum and minimum price points during the time.
Color:
Green (or White): The price was higher upon closing than opening (bullish).
Red (or Black): The price was lower upon closing than opening (bearish).
From their analysis, traders can contemplate that the trend is likely to continue, reverse, or create some ambiguity.

Candlestick patterns are the most fundamental tools of technical analysis for projecting future price of the asset. While strong confirmations come from multiple candle patterns, single candle patterns are a quick reference and strong signal that in one candle show indications of reversal, continuation, or indecision.
This guide will take you through a complete understanding of the major single candle patterns and their meanings, as well as guide through being able to apply them into trading.
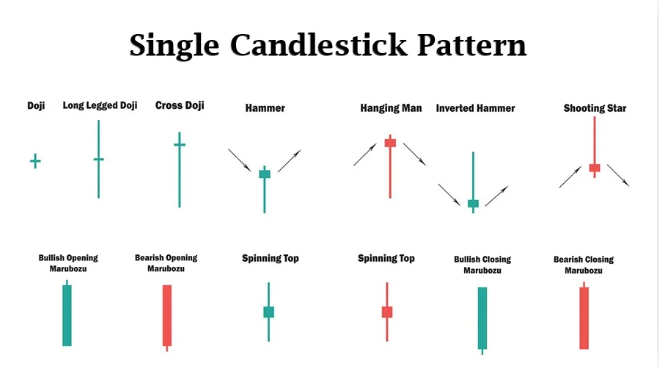
Single Candlestick Patterns
Single candlestick patterns speak volumes about market sentiments with just one candle. They form usually at important levels and are capable of hinting about bullish reversal, bearish reversal, or indecision.
Categorization of Single Candlestick Patterns: Single Candlestick Patterns are further categorized into three types, namely:
1. The Bullish Reversal Patterns: Such patterns mostly indicate a probable trend reversal from a downward to an upward trend.
2. The Bearish Reversal Patterns: Such patterns indicate possible trend reversals from bullish to bearish.
3. Indecision Pattern: It is one that results from uncertainty in the market and sets the stage for a possible breakout.
Bullish Reversal Single Candlestick Patterns
This indicates possible buying pressure coming in hence there is a likelihood for an upward move.
Hammer:
It reverses trends from down trending trends and occurs in that case. It is known as a small body up with a long shadow down, indicating that the buyers have regained control after initial selling pressure. However, a confirmation through a bullish candle would be wise before taking a trading decision.
Dragonfly Doji:
This candlestick is a one- candlestick pattern signaling possible trend reversal such as often found on the bottom of a downward trend. The candlestick has a long lower shadow, little or no upper shadow, as well as almost nonexistent body. This means the sellers depressed the price to an extent, and the buyers actually took over, closing just about at the opening price.
Indecision market it was; bears initially won the fight, but the close was for the bulls. The particular type of candlestick pattern’s appearance during a downward trend, price action action confirming directional movement, could indicate a potential bullish reversal. However, any movement traders are considering should first validate with any additional indicators volume analysis before a trade is made.
Inverted Hammer
It also refers to a single candlestick pattern that occurs near the bottom of a trend line of falling prices. It indicates that the market experienced some possible bullish reversal. Its typical characteristics include a small body at the bottom, a long upper shadow, and no or very little lower shadow, indicating that the price had resistance to the buyers’ attempts at increasing prices. The final price was almost equal to the opening price, but the pattern shows accumulation of buying pressure. It will strongly confirm it with a robust bullish candle within the next session before any trading moves are made.
Bearish Reversal Single Candlestick Patterns
These patterns indicate an increased possibility of selling pressure, which may be followed by an eventual decline.
Shooting Star
The Shooting Star is a bearish reversal candlestick formation that comes into play at the top of an uptrend. It has a small body low in the price range, a long upper shadow, with little or no lower shadow. The upper shadow indicates that buyers pushed the price up to that level but then surrendered the price as sellers took profit and pushed the price back down. If confirmed with a bear candle during the next session, this will add more strength to the reversal signal.
Gravestone Doji
The Gravestone Doji is a bearish reversal candlestick formation emerging at the top of an uptrend. Long upper shadow, a little to no lower shadow, and an almost negligible body tell that again buyers drove the price up but sales resumed control and drove it down to the opening level. If confirmed with a bearish candle, the reversal signal will further strengthen.
Hanging Man
The Hanging Man is a bearish reversal candlestick pattern at the end of an upward trend. It has a small body on the top and a long lower shadow having little or no upper shadow showing that sellers pushed down the price in the session but buyers tried to recover. If followed by a bearish candle, it would confirm the possible change in direction of trend.
Indecision Single Candlestick Patterns
Indecision Single Candlestick Patterns, like Doji and Spinning Top, indicate market uncertainty, where buyers and sellers are evenly matched. Traders wait for the next candle to confirm the trend direction.
Doji
A Doji is a candlestick pattern that signals market indecision, where the opening and closing prices are nearly the same. It has little to no real body with varying shadow lengths, indicating a balance between buyers and sellers. Depending on its position in a trend, a Doji can suggest a potential reversal or continuation, requiring confirmation from the next candlestick.
Spinning Top
A Spinning Top is a single candlestick pattern that has small bodies and long upper and lower wicks identifying indecision in the market. Both buyers and sellers were active, but neither could gain control. Confirming a potential trend reversal or continuation with the following candle is recommended for traders.
How to Trade Using Single Candlestick Patterns?
Step 1. Determine the Pattern.
Look for candlestick patterns in significant areas such as support, resistance, or trendlines.
Step 2. Confirm the Pattern:
i. Volume: the effect of high volume with high signal strength.
ii. RSI: Overbought or oversold.
iii. Moving Averages: With key levels crossed, enter at a certain candle open.
Step 3: Preparing the Entry and Exit Order:
Bullish Patterns: Entry at the closure of confirmation candle above the pattern.
Bearish Patterns: Entry at the closure of confirmation candle below the pattern.
Indecision Patterns: Wait for breakout before entering into a trade.
Step 4: Stop-Loss for Risk Management
Stop-loss below pattern lower for bullish trades.
Stop-loss above pattern high for bearish trades.
Final Thoughts
A single candlestick pattern is a strong weapon toward market psychology information in a very short time. It should technically be possible combined with other indicators and proper strategies for risk management.
So those who learn these patterns will successfully distinguish reversal patterns and be pointed toward its confirmation trends for confident and better decision making in trading.
Want to master these patterns? Connect with Chanakya Investments for expert guidance!